Llama 3.1, the latest open-source model by Meta, features multi-step reasoning, integrated tool search, and a code interpreter. The LLM comes in three sizes: 8B, 70B, and 405B. Especially in the 405B version, Llama 3.1 challenges top LLMs in areas like general knowledge, math, tool use, and multilingual translation.
In this post, we will look closer at the code generation and code execution capabilities of Llama 3.1. We will give a step-by-step tutorial for securely running the LLM-generated code with E2B, in a Python or JavaScript/TypeScript version.
Approaches to run code with Llama 3.1
Similar to other LLMs (e.g., GPT or Claude), there are two different options to generate code with Llama 3.1. You can utilize the built-in function calling support (if your LLM provider supports that), or you can add your own way to handle code generation.
1. Built-in function calling support
This approach is native to Llama 3.1 and easy to use. The function calling means that you are allowed to add “tools” that the LLM can decide to call.
The tools are usually defined in JSON, detailing their name, description, and the necessary input schema required to execute Python code in a Jupyter notebook environment.
It is recommended to pick 70B or 405B if you want to have a full conversation with function calling. Function calling doesn't necessarily imply code execution capabilities. Llama 3.1 models are trained to identify prompts that can be answered with their built-in code interpreter tool and provide the ppropriate Python function calls to achieve the result. You still have to make an implementation that produces valid results for the given query.
In general, the tools can serve various use cases, from searching the internet to running the generated code. They often include API calls to third-party apps.
Llama 3.1 also offers built-in support for tools:
Brave Search used to perform web searches.
Wolfram Alpha used to perform complex mathematical calculations.
Code Interpreter used to run the Python code generated by the LLM
This means that the LLM has been fine-tuned to more accurately make use of these functions, but you are still in charge of implementing them.
Even though Llama 3.1 supports the tool calling, I have struggled with it while generating bigger pieces of code. The model often stopped the generation before completing the code. This led me to use the second option - adding my own way of instructing Llama 3.1 to generate complete and good-quality code.
2. Manual approach with Markdown
When a LLM lacks built-in support for function calling, we can still achieve the same result. In this approach, we instruct Llama 3.1 to return just plain markdown code blocks that we manually parse and pass to the code interpreter.
We instruct the model on how to generate code in a suitable format, and we programmatically add a way to parse the code and have it prepared for running.
In the system prompt, we prompt the model to return a code response that matches the desired format. That means an output formatted correctly in Markdown with Python code blocks. We need to also specify the parsing of the code for the code interpreter we will use to run the code.
This approach might seem more difficult, but it is more universal and applicable beyond Llama 3.1, regardless of whether the particular LLM supports function calling.
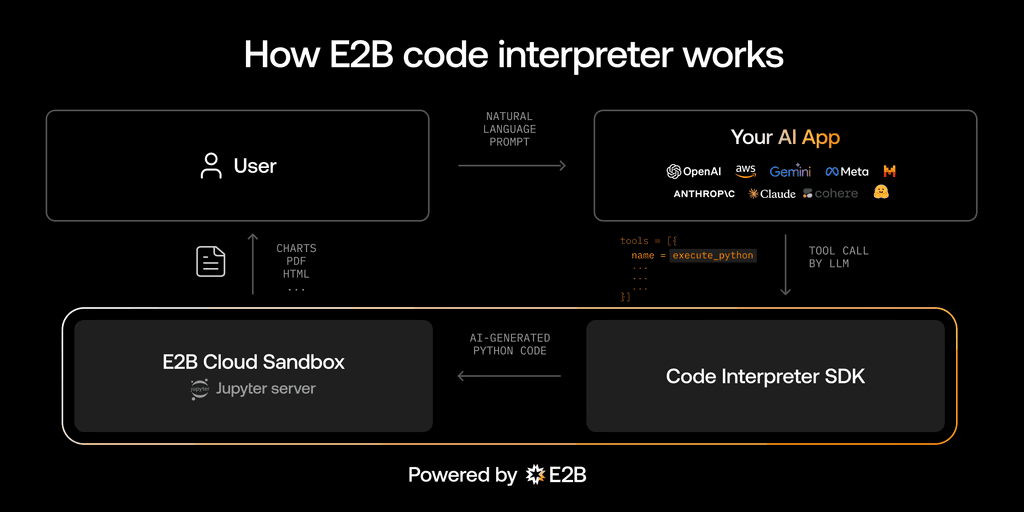
Both approaches can use the E2B Code Interpreter SDK for securely executing the code generated by Llama 3.1. Executing the code produced by an LLM is a problem separate from the code generation, and there are different approaches to that. We chose the Code Interpreter SDK which runs the AI-generated code inside an open-source secure cloud sandbox, which is specifically made for running untrusted AI-generated code.
In this guide, we will demonstrate an example of the second approach.
In case you are interested in the first approach, there is a great tutorial by Together AI for the native function calling with Llama 3.1.
Guide: Code interpreting with Llama 3.1 and E2B Code Interpreter SDK
We will show how to build an AI assistant that analyzes a CSV file with socioeconomic data, runs code to analyze them, and generates a chart as a result.
The assistant will be powered by Llama 3.1 on Together AI and using the open-source Code Interpreter SDK by E2B. The E2B Code Interpreter SDK quickly creates a secure cloud sandbox powered by Firecracker. Inside this sandbox is a running Jupyter server that the LLM can use.
The Code Interpreter SDK works for both approaches we mentioned (built-in function calling or manually parsing the code). It is used to execute the AI-generated code, regardless of what approach and what LLM was used to provide the code.

Key links
Outline
Prerequisites
Install the SDKs
Set up the API keys and model instructions
Add code interpreting capabilities and initialize the model
Upload the dataset
Put everything together
Run the program and see the results
1. Prerequisites
Create a main.ipynb file.
Get the E2B API key here and the Together AI API key here.
Download the CSV file from here and upload it to the same directory as your program. Rename it to data.csv.
2. Install the SDKs
pip install together==0.6.0 e2b-code-interpreter==0.0.10 dotenv==1.0.0
3. Set up the API keys and model instructions
In this step we set up the E2B and Together API keys. They are added directly to the notebook.
You pick the model of your choice by uncommenting it. There are some recommended models that are great at code generation, but you can add a different one from here.
The model is assigned a data scientist role and explained the uploaded CSV. If you use your custom CSV file, don’t forget to update the system prompt accordingly.
import os
from dotenv import load_dotenv
import os
import json
import re
from together import Together
from e2b_code_interpreter import CodeInterpreter
load_dotenv()
TOGETHER_API_KEY = os.getenv("TOGETHER_API_KEY")
E2B_API_KEY = os.getenv("E2B_API_KEY")
MODEL_NAME = "meta-llama/Meta-Llama-3.1-405B-Instruct-Turbo"
SYSTEM_PROMPT = """You're a Python data scientist. You are given tasks to complete and you run Python code to solve them.
Information about the csv dataset:
- It's in the `/home/user/data.csv` file
- The CSV file is using , as the delimiter
- It has the following columns (examples included):
- country: "Argentina", "Australia"
- Region: "SouthAmerica", "Oceania"
- Surface area (km2): for example, 2780400
- Population in thousands (2017): for example, 44271
- Population density (per km2, 2017): for example, 16.2
- Sex ratio (m per 100 f, 2017): for example, 95.9
- GDP: Gross domestic product (million current US$): for example, 632343
- GDP growth rate (annual %, const. 2005 prices): for example, 2.4
- GDP per capita (current US$): for example, 14564.5
- Economy: Agriculture (% of GVA): for example, 10.0
- Economy: Industry (% of GVA): for example, 28.1
- Economy: Services and other activity (% of GVA): for example, 61.9
- Employment: Agriculture (% of employed): for example, 4.8
- Employment: Industry (% of employed): for example, 20.6
- Employment: Services (% of employed): for example, 74.7
- Unemployment (% of labour force): for example, 8.5
- Employment: Female (% of employed): for example, 43.7
- Employment: Male (% of employed): for example, 56.3
- Labour force participation (female %): for example, 48.5
- Labour force participation (male %): for example, 71.1
- International trade: Imports (million US$): for example, 59253
- International trade: Exports (million US$): for example, 57802
- International trade: Balance (million US$): for example, -1451
- Education: Government expenditure (% of GDP): for example, 5.3
- Health: Total expenditure (% of GDP): for example, 8.1
- Health: Government expenditure (% of total health expenditure): for example, 69.2
- Health: Private expenditure (% of total health expenditure): for example, 30.8
- Health: Out-of-pocket expenditure (% of total health expenditure): for example, 20.2
- Health: External health expenditure (% of total health expenditure): for example, 0.2
- Education: Primary gross enrollment ratio (f/m per 100 pop): for example, 111.5/107.6
- Education: Secondary gross enrollment ratio (f/m per 100 pop): for example, 104.7/98.9
- Education: Tertiary gross enrollment ratio (f/m per 100 pop): for example, 90.5/72.3
- Education: Mean years of schooling (female): for example, 10.4
- Education: Mean years of schooling (male): for example, 9.7
- Urban population (% of total population): for example, 91.7
- Population growth rate (annual %): for example, 0.9
- Fertility rate (births per woman): for example, 2.3
- Infant mortality rate (per 1,000 live births): for example, 8.9
- Life expectancy at birth, female (years): for example, 79.7
- Life expectancy at birth, male (years): for example, 72.9
- Life expectancy at birth, total (years): for example, 76.4
- Military expenditure (% of GDP): for example, 0.9
- Population, female: for example, 22572521
- Population, male: for example, 21472290
- Tax revenue (% of GDP): for example, 11.0
- Taxes on income, profits and capital gains (% of revenue): for example, 12.9
- Urban population (% of total population): for example, 91.7
Generally, you follow these rules:
- ALWAYS FORMAT YOUR RESPONSE IN MARKDOWN
- ALWAYS RESPOND ONLY WITH CODE IN CODE BLOCK LIKE THIS:
```python
{code}
```
- the Python code runs in jupyter notebook.
- every time you generate Python, the code is executed in a separate cell. it's okay to make multiple calls to `execute_python`.
- display visualizations using matplotlib or any other visualization library directly in the notebook. don't worry about saving the visualizations to a file.
- you have access to the internet and can make api requests.
- you also have access to the filesystem and can read/write files.
- you can install any pip package (if it exists) if you need to be running `!pip install {package}`. The usual packages for data analysis are already preinstalled though.
- you can run any Python code you want, everything is running in a secure sandbox environment
"""
4. Add code interpreting capabilities and initialize the model
Now we define the function that will use the code interpreter by E2B. Every time the LLM assistant decides that it needs to execute code, this function will be used. Read more about the Code Interpreter SDK here.
We also initialize the Together AI client. The function for matching code blocks is important because we need to pick the right part of the output that contains the code produced by the LLM. The chat function takes care of the interaction with the LLM. It calls the E2B code interpreter anytime there is a code to be run.
def code_interpret(e2b_code_interpreter, code):
print("Running code interpreter...")
exec = e2b_code_interpreter.notebook.exec_cell(
code,
on_stderr=lambda stderr: print("[Code Interpreter]", stderr),
on_stdout=lambda stdout: print("[Code Interpreter]", stdout),
)
if exec.error:
print("[Code Interpreter ERROR]", exec.error)
else:
return exec.results
client = Together(api_key=TOGETHER_API_KEY)
pattern = re.compile(
r"```python\n(.*?)\n```", re.DOTALL
)
def match_code_blocks(llm_response):
match = pattern.search(llm_response)
if match:
code = match.group(1)
print(code)
return code
return ""
def chat_with_llm(e2b_code_interpreter, user_message):
print(f"\n{'='*50}\nUser message: {user_message}\n{'='*50}")
messages = [
{"role": "system", "content": SYSTEM_PROMPT},
{"role": "user", "content": user_message},
]
response = client.chat.completions.create(
model=MODEL_NAME,
messages=messages,
)
response_message = response.choices[0].message
python_code = match_code_blocks(response_message.content)
if python_code != "":
code_interpreter_results = code_interpret(e2b_code_interpreter, python_code)
return code_interpreter_results
else:
print(f"Failed to match any Python code in model's response {response_message}")
return []
5. Upload the dataset
The CSV data is uploaded programmatically, not via AI-generated code. The code interpreter by E2B runs inside the E2B sandbox. Read more about the file upload here.
def upload_dataset(code_interpreter):
    print("Uploading dataset to Code Interpreter sandbox...")
    dataset_path = "./data.csv"

    if not os.path.exists(dataset_path):
        raise FileNotFoundError("Dataset file not found")

    try:
        with open(dataset_path, "rb") as f:
            remote_path = code_interpreter.upload_file(f)

        if not remote_path:
            raise ValueError("Failed to upload dataset")

        print("Uploaded at", remote_path)
        return remote_path
    except Exception as error:
        print("Error during file upload:", error)
        raise error
6. Put everything together
Finally we put everything together and let the AI assistant upload the data, run an analysis, and generate a PNG file with a chart.
You can update the task for the assistant in this step. If you decide to change the CSV file you are using, don't forget to update the prompt too.
with CodeInterpreter(api_key=E2B_API_KEY) as code_interpreter:
upload_dataset(code_interpreter)
code_results = chat_with_llm(
code_interpreter,
"Make a chart showing linear regression of the relationship between GDP per capita and life expectancy from the data. Filter out any missing values or values in wrong format.",
)
if code_results:
first_result = code_results[0]
else:
raise Exception("No code interpreter results")
first_result
7. Run the program and see the results
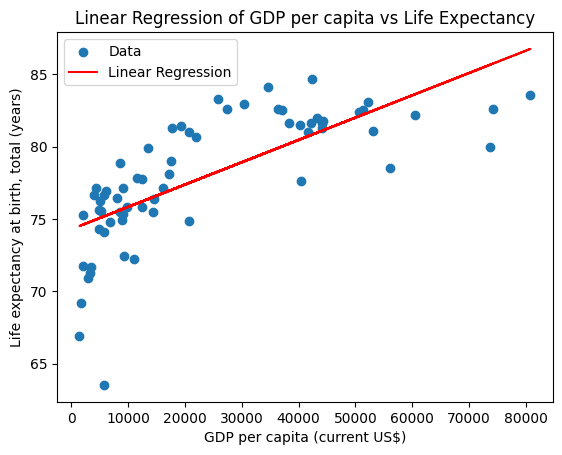
The resulting chart is generated within the notebook environment. The plot shows the linear regression of the relationship between GDP per capita and life expectancy from the CSV data.
Uploading dataset to Code Interpreter sandbox...
Uploaded at /home/user/data.csv
==================================================
User message: Make a chart showing linear regression of the relationship between GDP per capita and life expectancy from the data. Filter out any missing values or values in wrong format.
==================================================
import pandas as pd
import matplotlib.pyplot as plt
from sklearn.linear_model import LinearRegression
data = pd.read_csv('/home/user/data.csv', delimiter=',')
data = data.dropna(subset=['GDP per capita (current US$)', 'Life expectancy at birth, total (years)'])
data['GDP per capita (current US$)'] = pd.to_numeric(data['GDP per capita (current US$)'], errors='coerce')
data['Life expectancy at birth, total (years)'] = pd.to_numeric(data['Life expectancy at birth, total (years)'], errors='coerce')
X = data['GDP per capita (current US$)'].values.reshape(-1, 1)
y = data['Life expectancy at birth, total (years)'].values.reshape(-1, 1)
model = LinearRegression().fit(X, y)
plt.scatter(X, y, color='blue')
...
plt.xlabel('GDP per capita (current US$)')
plt.ylabel('Life expectancy at birth, total (years)')
plt.show()
Running code interpreter...

Resources


